EVG showcase
EVG is the layout engine behind Ranger's PDF and image writers: a print-safe CSS subset — flex, grid, a stylesheet layer and real TrueType metrics — with no browser anywhere in the pipeline.
Every page below is the same tree rendered under two themes and three
targets. The .tsx files carry no colours, sizes or spacing:
they say what is on the page, and one stylesheet says how it looks.
VlChart API into the browser and dispatches the
lines you type to it, method by method, drawing the answer as you edit.
@media blocks, vw lengths and the
card grid are resolved by the compiled engine in the browser, and the
browser is handed finished pixels — drag the window edge and watch the
whole pipeline run again. The same page as
retained DOM: one node per element, kept across frames and patched from
the engine's own diff (EVGHostTree) — open the dev tools
and the picture is a tree you can read.
turdsize, alphamax, color posterize) and
vectorize in the browser with the compiled EvgBitmapTracer.
Nothing is uploaded — the image stays on the page.
Album spread open the page ›
grid-template-areas draws the spread as a picture of names, so a theme can rearrange it without touching the tree.
album.tsx — no visual attributes; every rule is in showcase.css
Cards on shared rows open the page ›
Three cards, three caption lengths, one baseline. Each card spans the deck's rows and declares grid-template-rows: subgrid, so the photo band and the caption band are shared.
cards.tsx — no visual attributes; every rule is in showcase.css
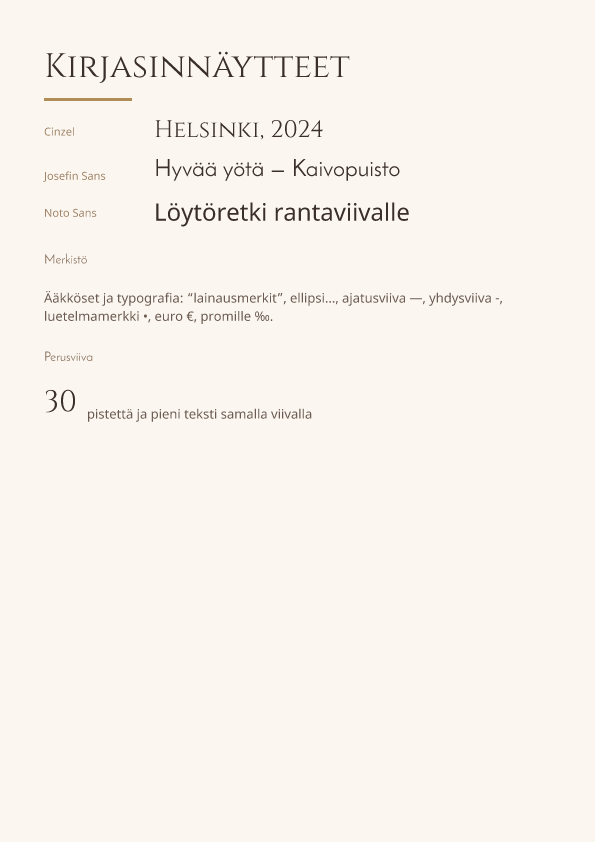
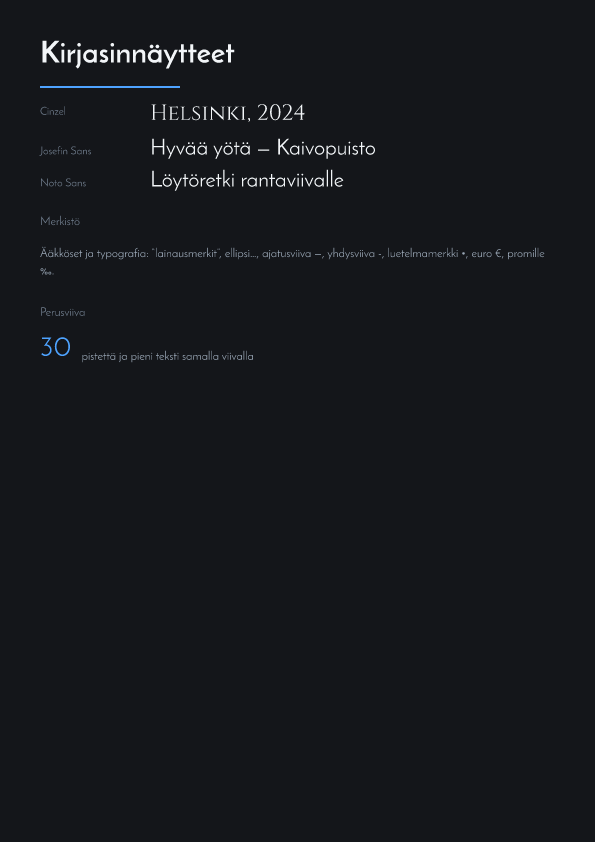
Type specimens open the page ›
Measured from the same TTF the page is painted with, kerned from the font's own GPOS pairs, and encoded so ä, — and “ ” survive the trip to PDF.
typography.tsx — no visual attributes; every rule is in showcase.css
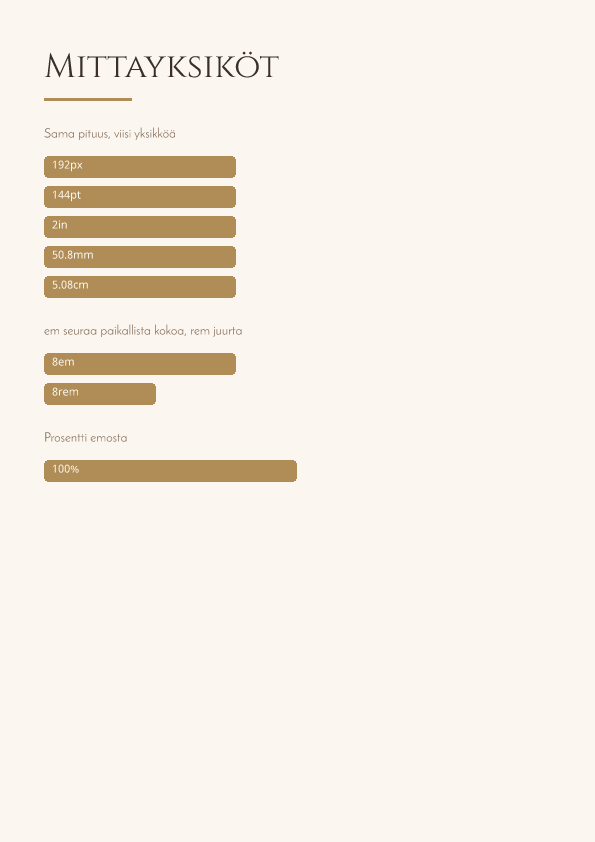
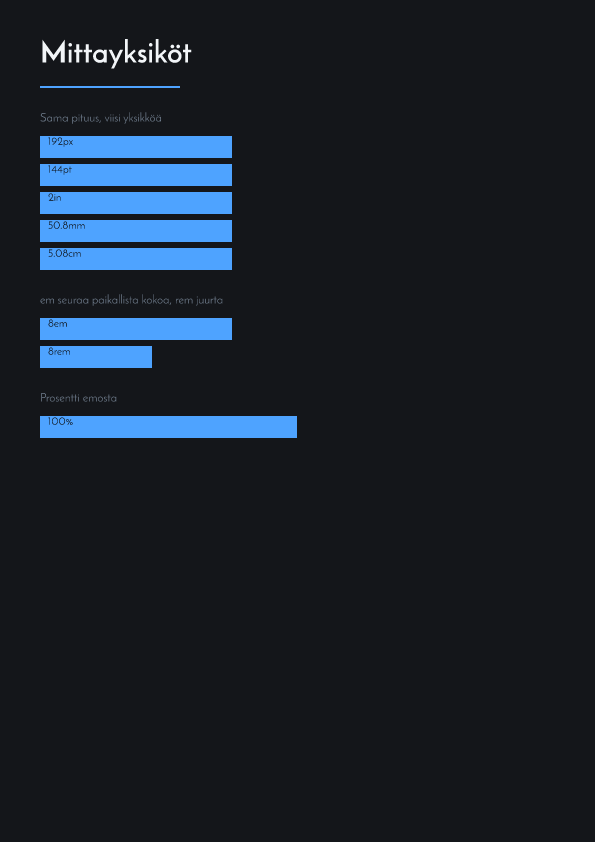
Length units open the page ›
Five bars declared in five units, all the same length, because CSS pins them to the reference pixel. em follows the local font-size; rem stays with the root.
units.tsx — no visual attributes; every rule is in showcase.css
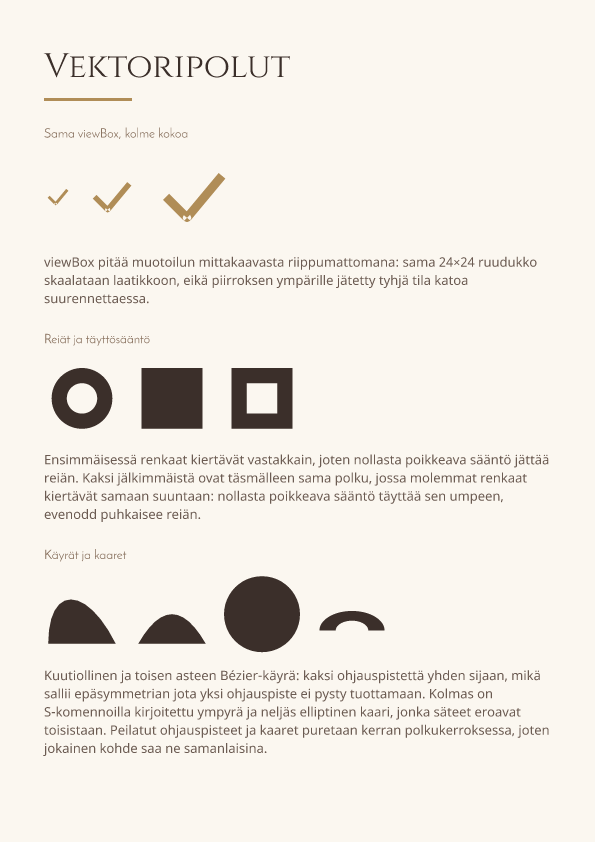
Vector paths open the page ›
One path parser, one viewBox transform, three targets: real vector operators in the PDF, an inline <svg> in the HTML, and the same anti-aliased scanline fill that paints this page's glyphs in the PNG.
vector.tsx — no visual attributes; every rule is in showcase.css
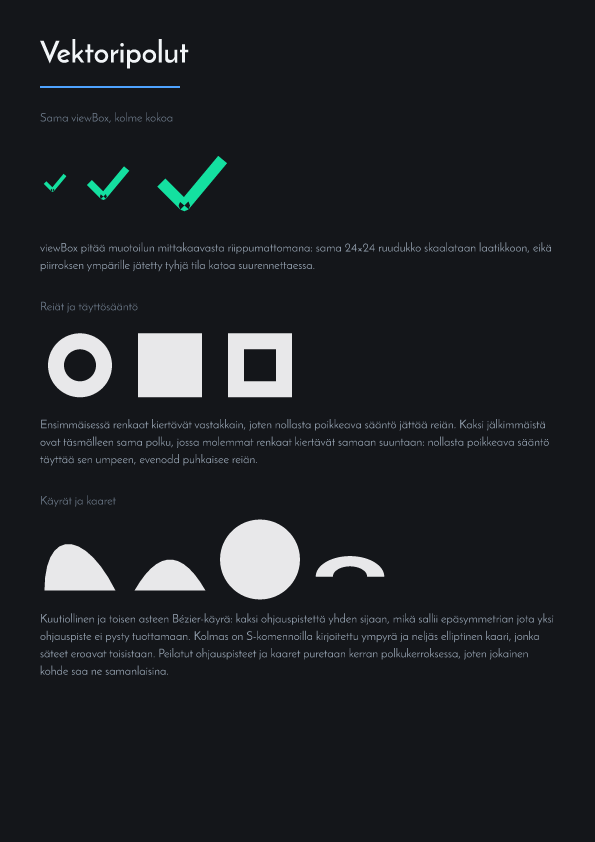
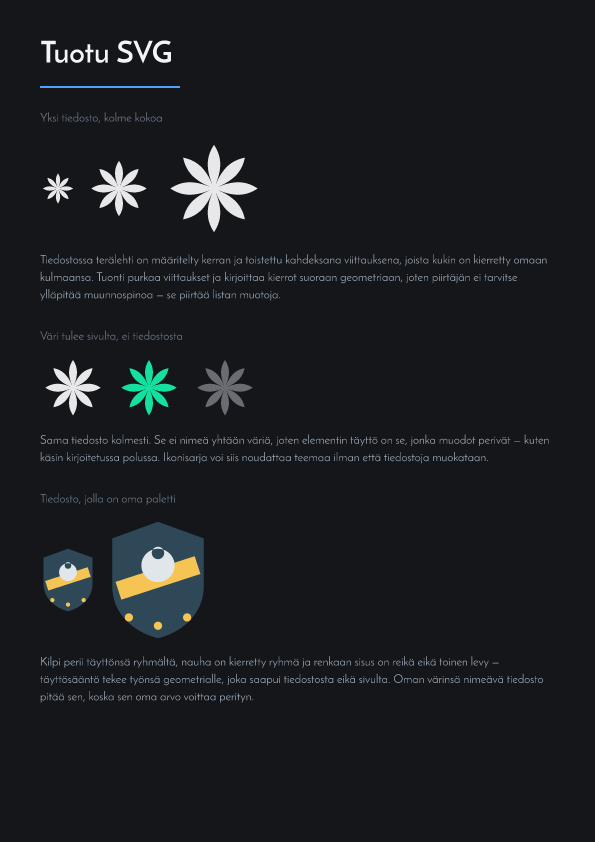
Imported SVG open the page ›
Two SVG files read into the same vector layer the rest of the gallery draws with: groups resolved, transforms baked into the geometry, <use> expanded where it is referenced. The browser is handed the resolved shapes rather than the original markup, so the preview cannot draw anything the printer will not.
svg.tsx — no visual attributes; every rule is in showcase.css

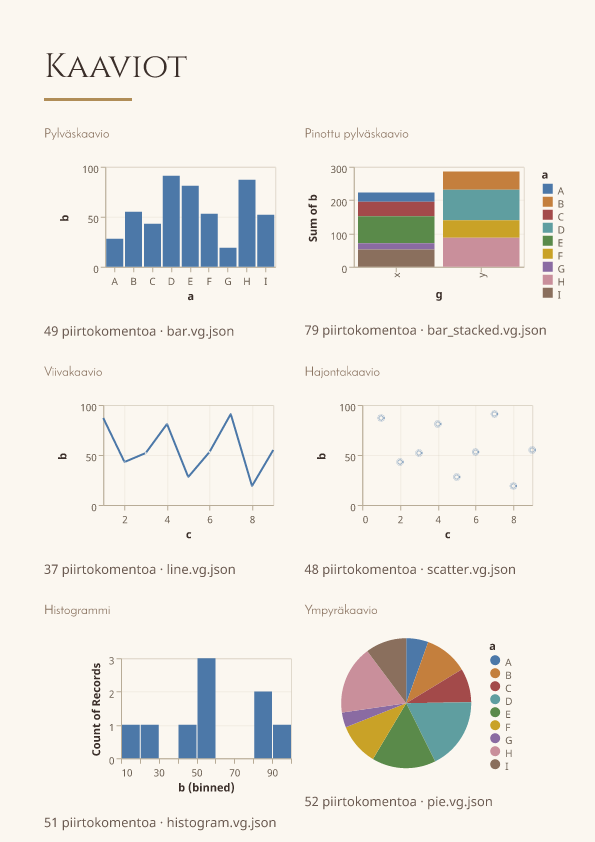
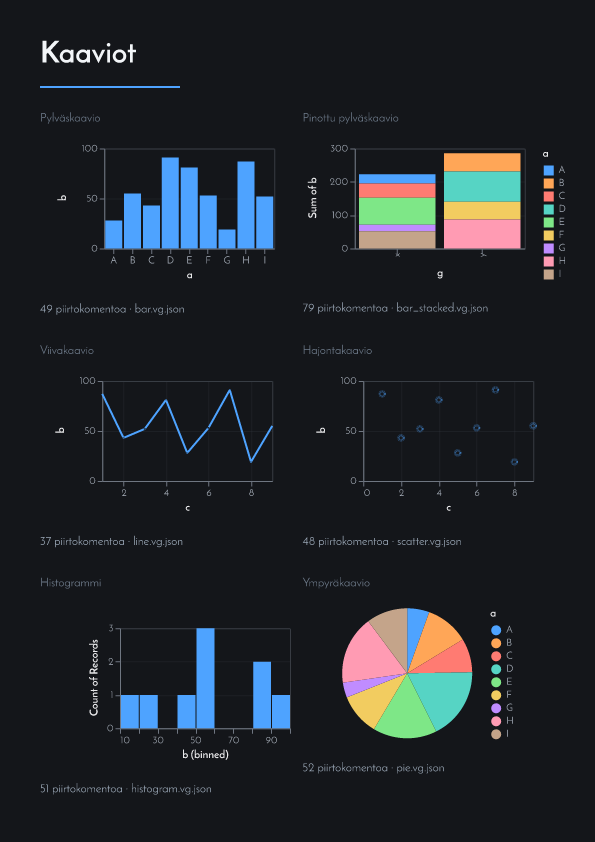
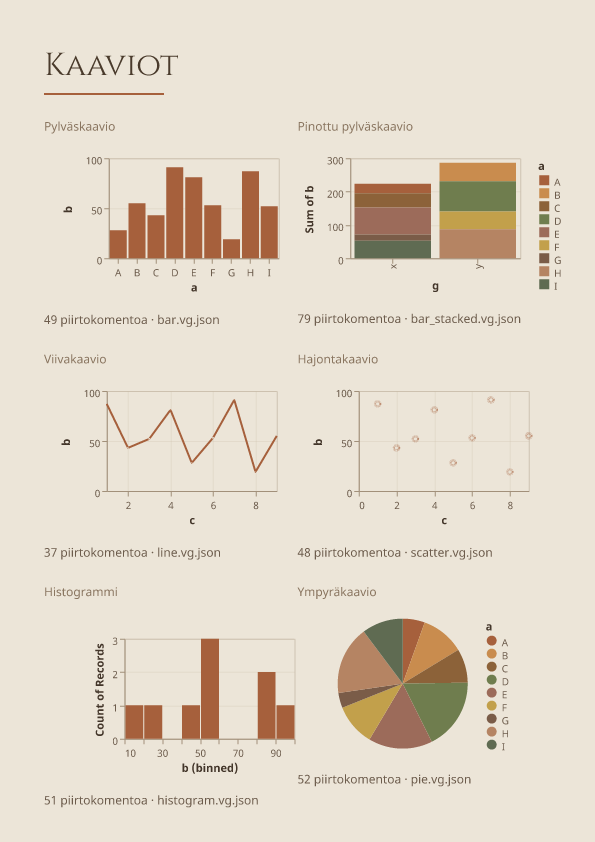
Charts open the page ›
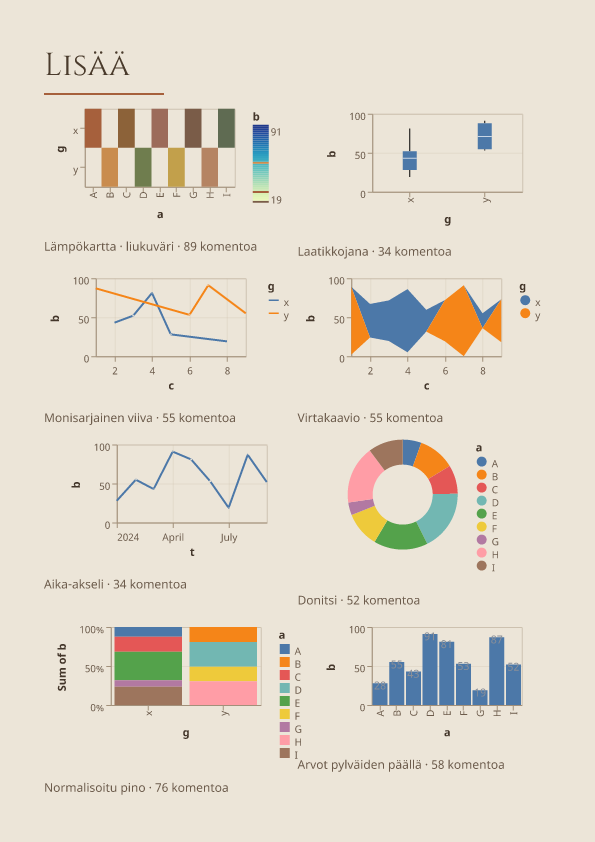
Unmodified Vega specifications, compiled from Vega-Lite examples and run by the Vela runtime in this repository: every gridline, bar, wedge, key and label is geometry Ranger computed and the EVG vector layer drew. The page is generated, and its colours are not in it — the series are numbered and the stylesheet paints them, so the same charts come out in three palettes, legends included.
charts.tsx — no visual attributes; every rule is in showcase.css
Charts, called open the page ›
The only page here whose charts came from a program rather than from a specification: each one was built by calling Vela's chart API (gallery/vela/src/VlChart.rgr), and the lines printed above it are the calls that built it — read out of the generating tool's own source, so the code on the page and the code that drew it cannot drift apart. A view's encoding is inherited by its marks, and no channel says what it is: a column of ISO dates is an instant, a column of numbers is a quantity, read off the data.
chart_api.tsx — no visual attributes; every rule is in showcase.css
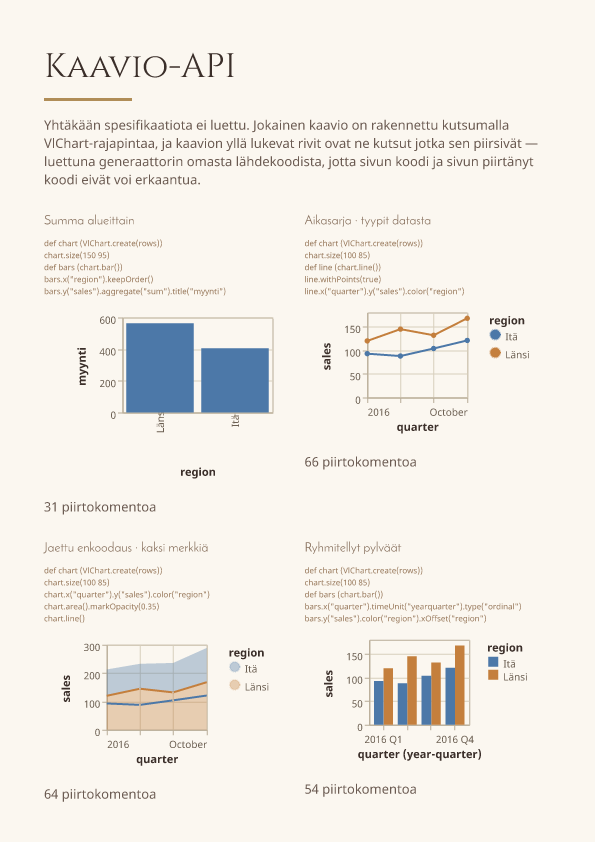
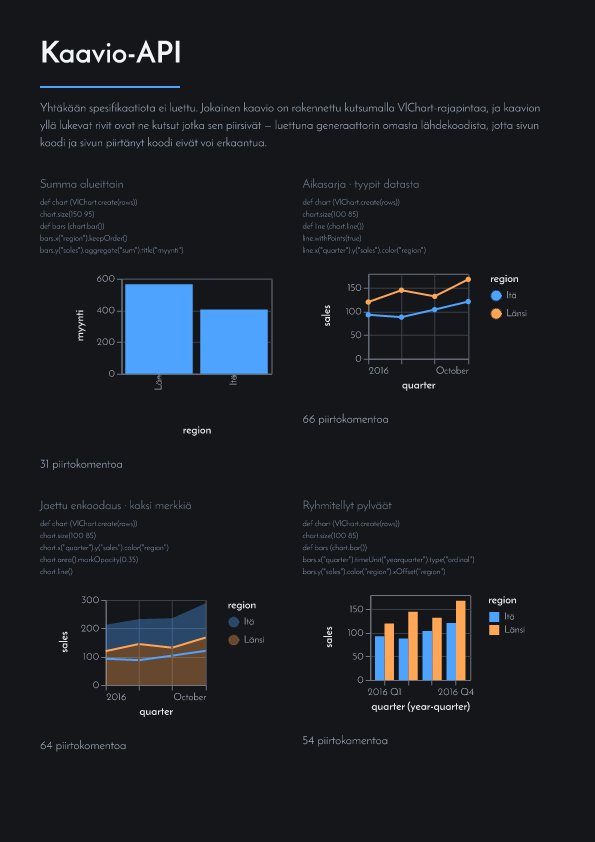
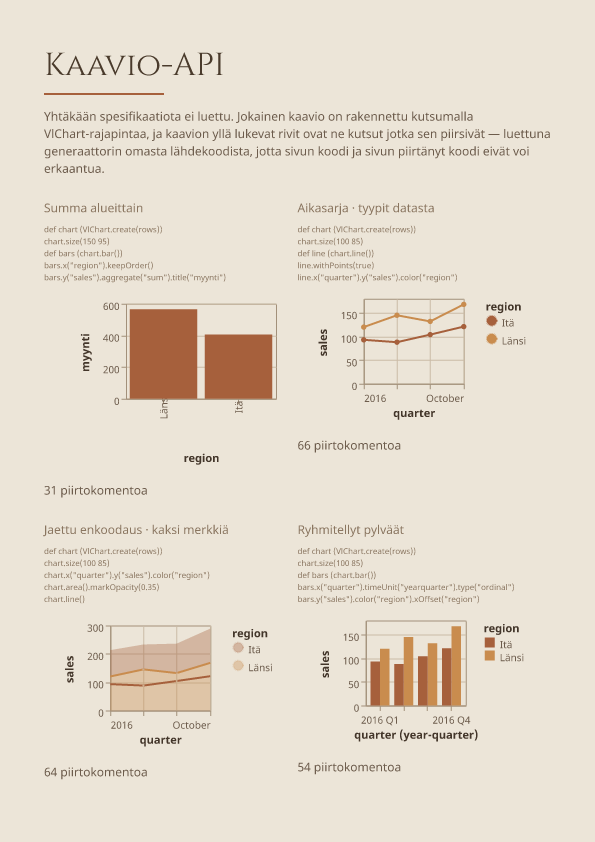
Chart types open the page ›
The rest of the runtime's chart types, and the features only some charts have: a size legend whose rows are all different heights, a stroke legend, a log axis that labels only some of the ticks it draws, two marks sharing one plot, and text as a mark. Generated from the same specifications the parity harness compares against official Vega.
plots.tsx — no visual attributes; every rule is in showcase.css
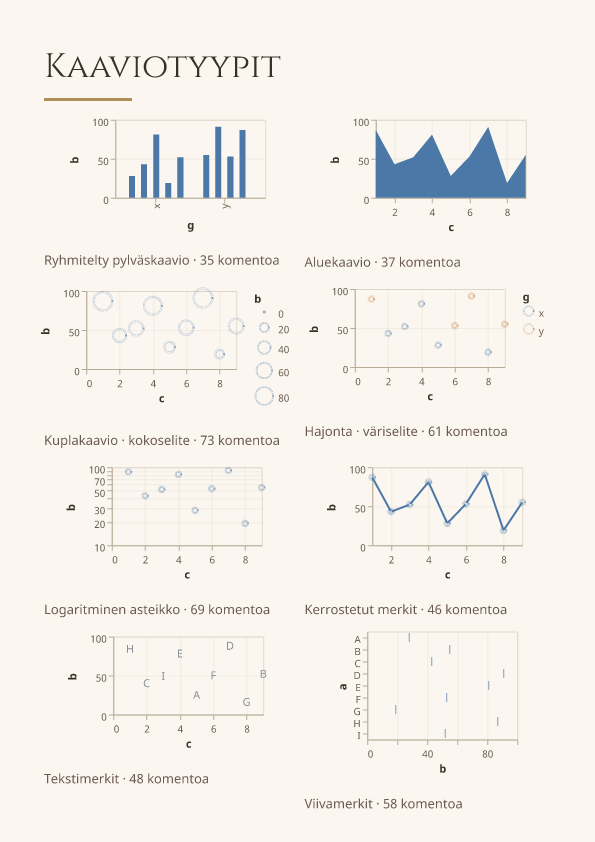
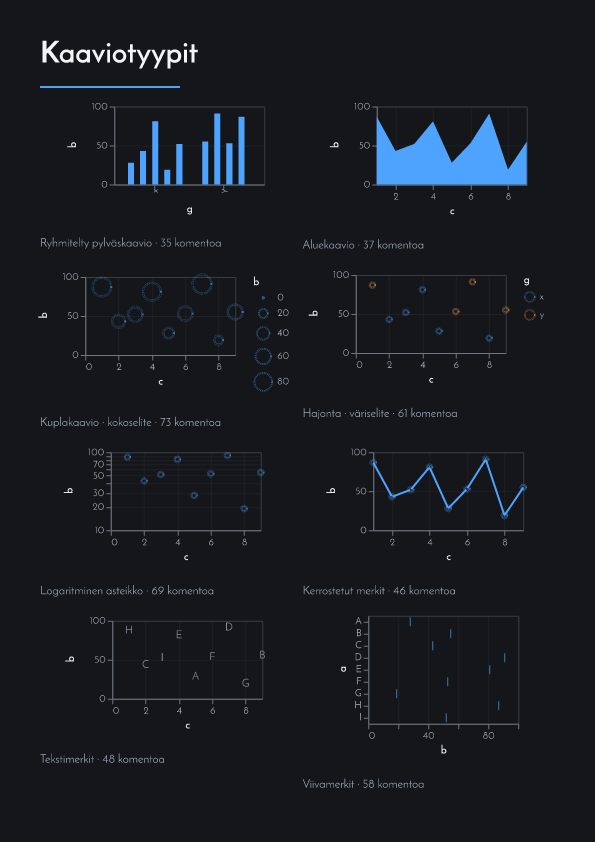
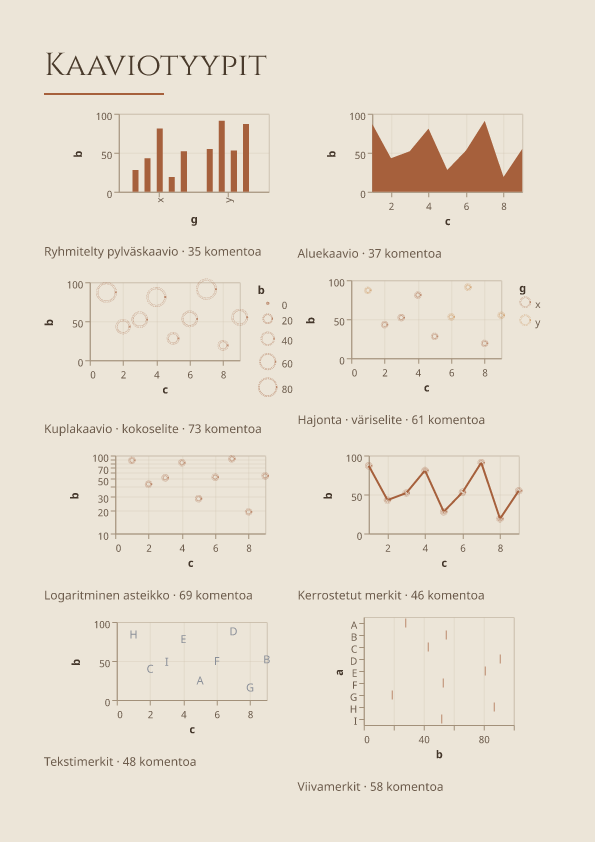
More chart types open the page ›
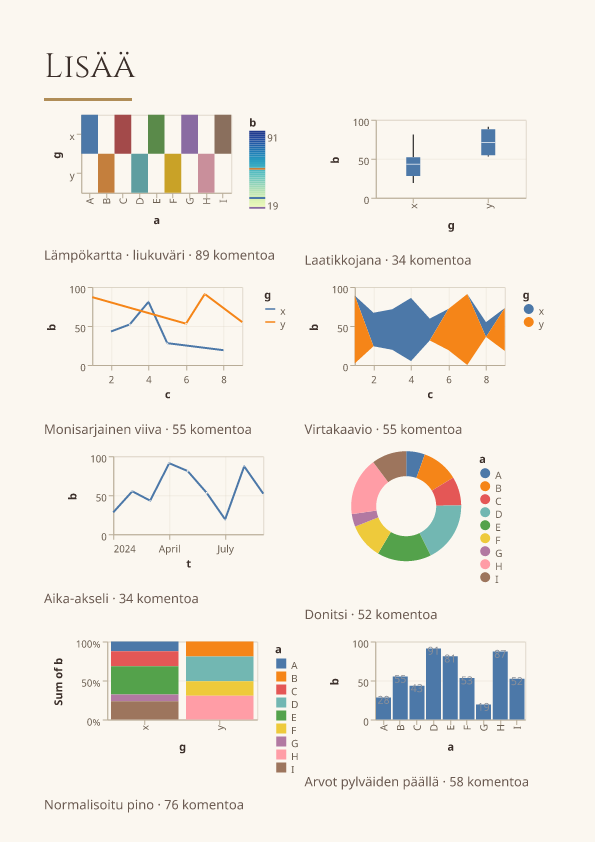
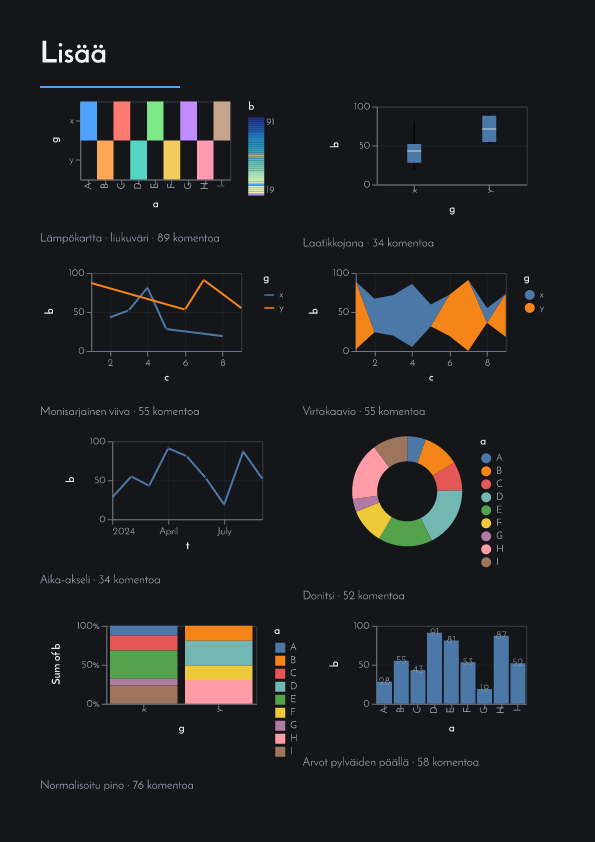
The chart types the runtime learned most recently, which are also the ones that exercise the most of it: a continuous colour ramp with the gradient key it earns, a series that is a faceted group of its own, a stack centred on a common line, a calendar on an axis, and a box plot whose quartiles are computed rather than approximated.
more.tsx — no visual attributes; every rule is in showcase.css
Variants open the page ›
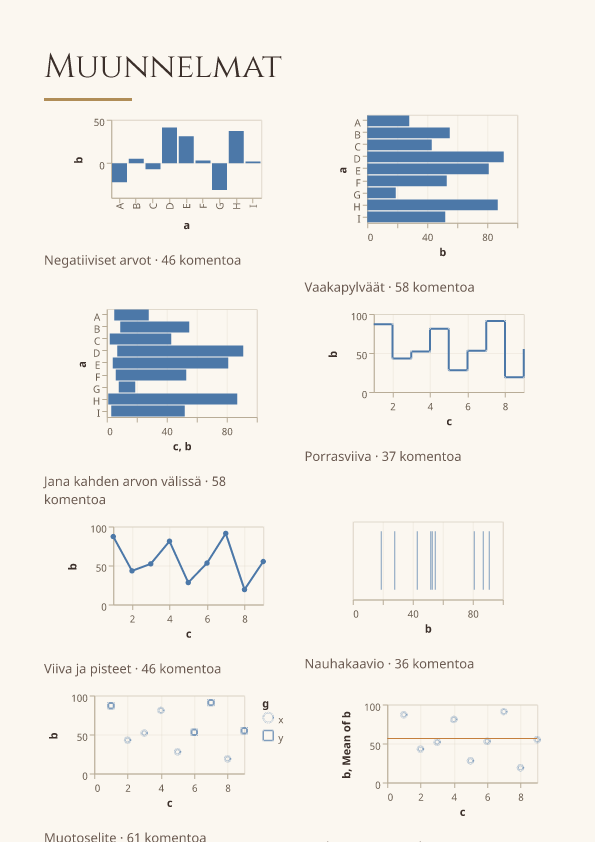
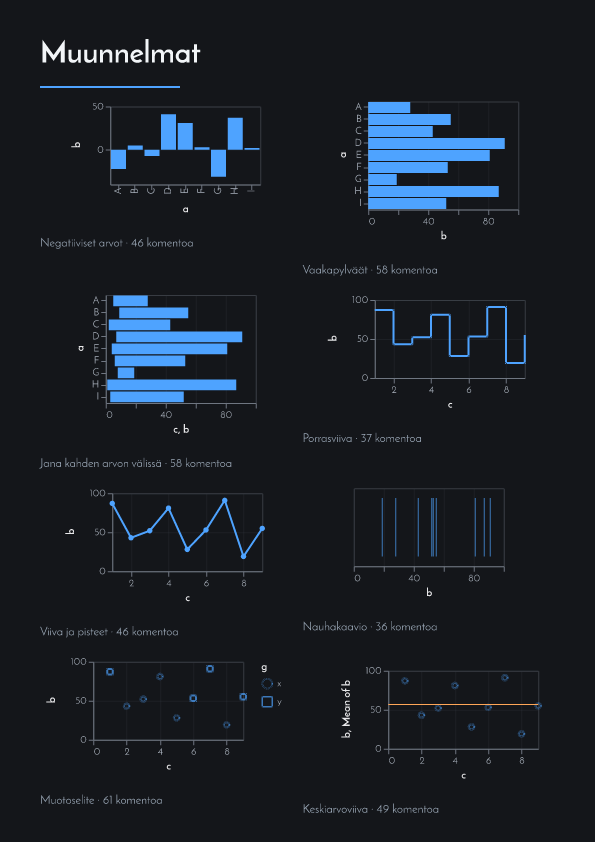
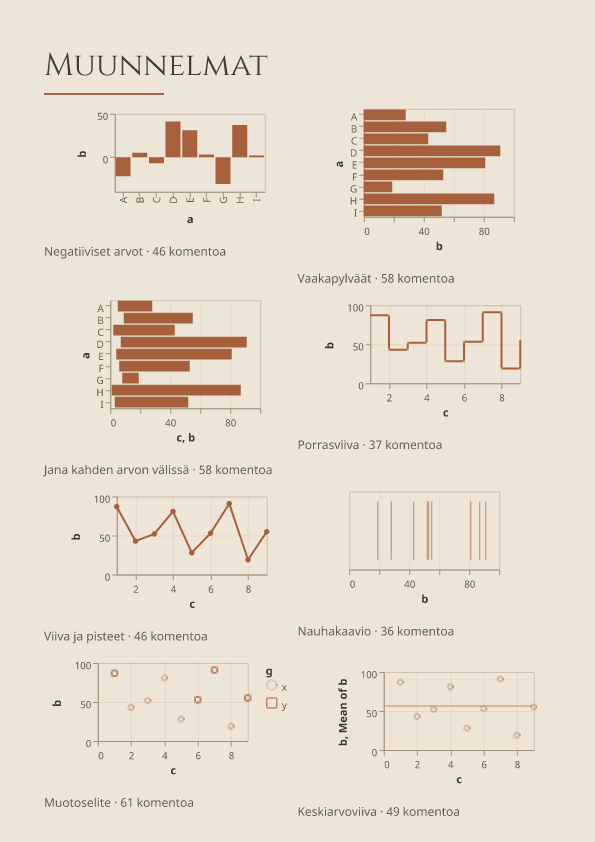
The same marks a chart already on this showcase uses, drawn a different way — bars that go down as well as up, bars that lie on their side, a bar between two values rather than from a baseline, a line that steps instead of sloping, a line that shows its own vertices, a single row of ticks, a shape legend, a mean drawn across the plot, and a pie whose wedges differ in length as well as angle. It is the variants that break a runtime rather than the types.
variants.tsx — no visual attributes; every rule is in showcase.css
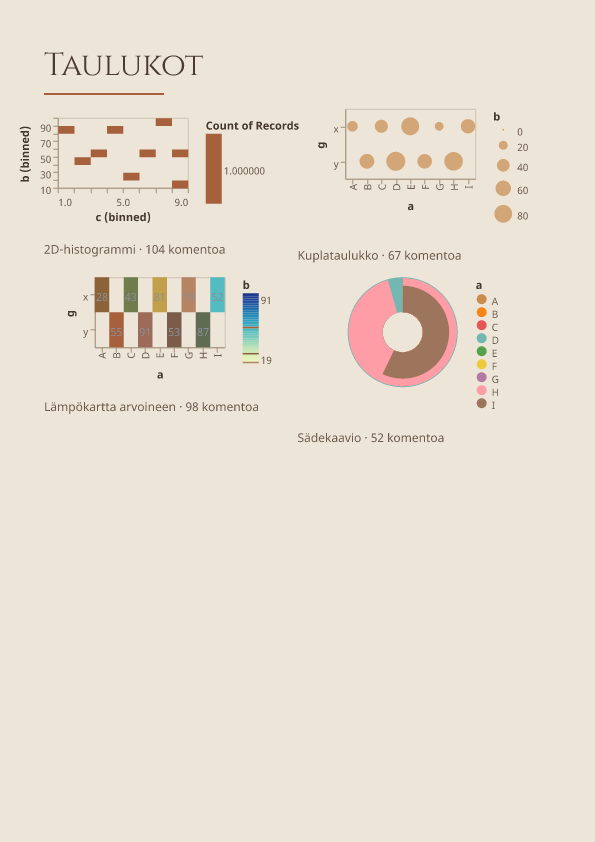
Tables open the page ›
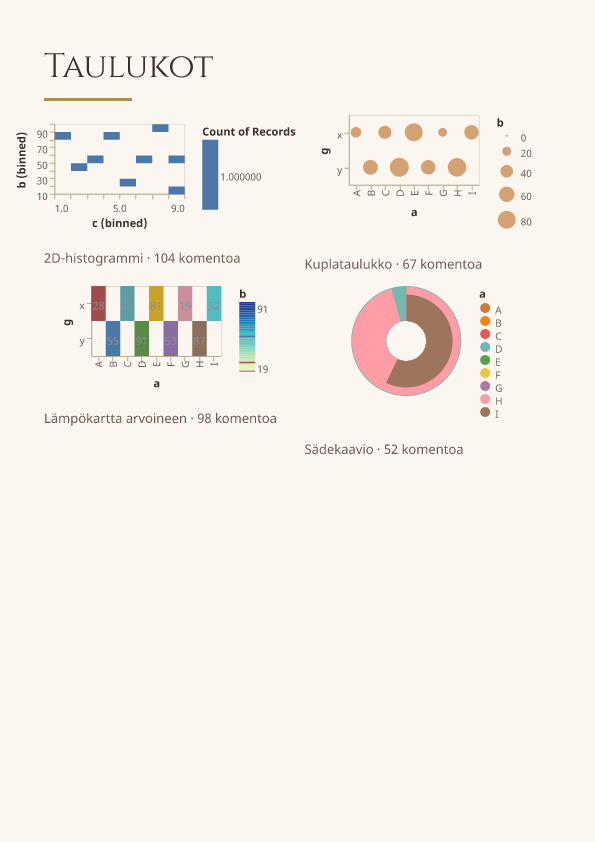
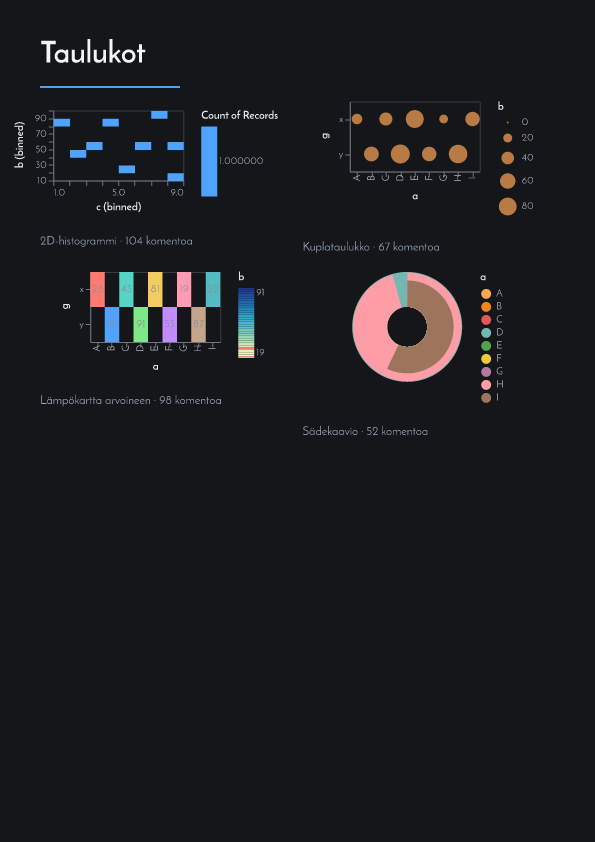
The plots where the cell is the datum: both axes are categories, or both are bins, and the value is carried by the cell's colour, its area, or the number printed in it. The two-dimensional histogram is the one that exercises the most — it bins on both axes, counts what lands in each cell, and ticks its axes on the bin edges rather than wherever a tick algorithm would have put them.
tables.tsx — no visual attributes; every rule is in showcase.css
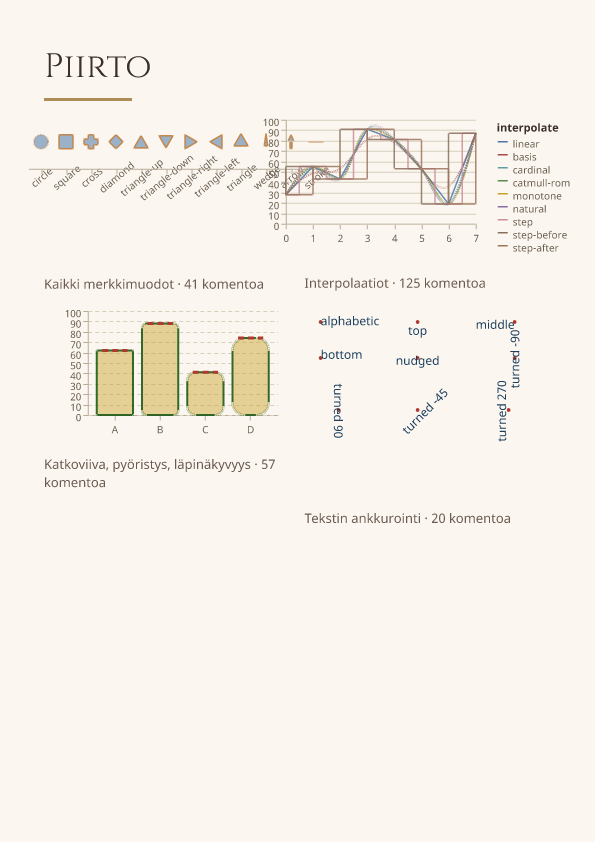
What a renderer has to get right open the page ›
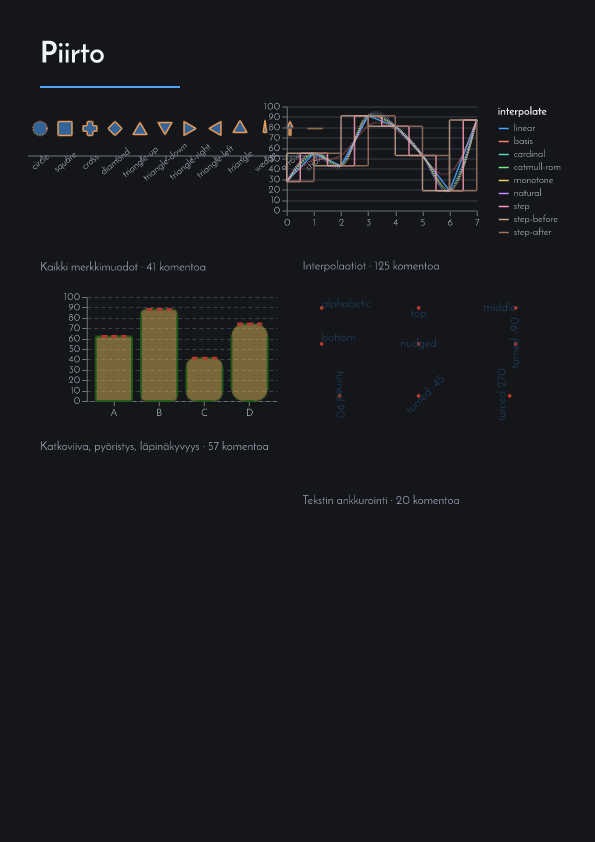
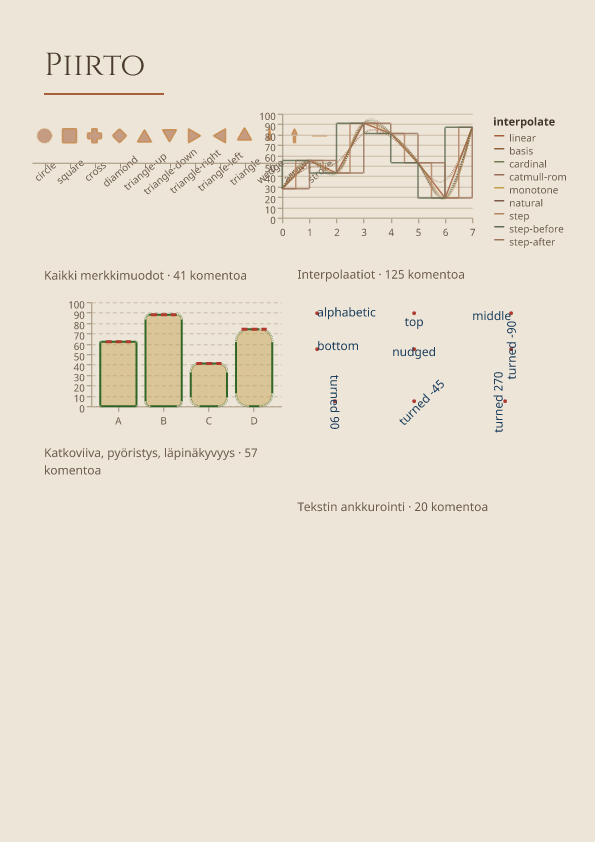
Four specifications that exist to be drawn rather than to say anything: every symbol shape the grammar offers, every interpolation that joins a line's points, the paint channels that change the ink without moving it — a dash pattern, a rounded corner, a square cap, a fill more translucent than its own outline — and a label against each alignment, baseline, nudge and angle. A scenegraph says "diamond" and stops; these are the specs that make a renderer say what a diamond looks like, and each of them is compared against the picture official Vega's own renderer produces.
drawing.tsx — no visual attributes; every rule is in showcase.css
More than one chart open the page ›
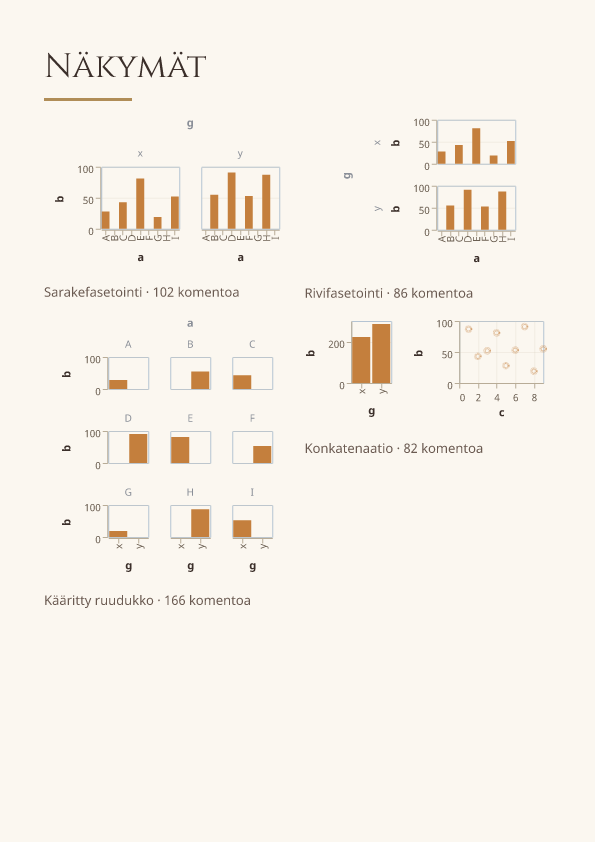
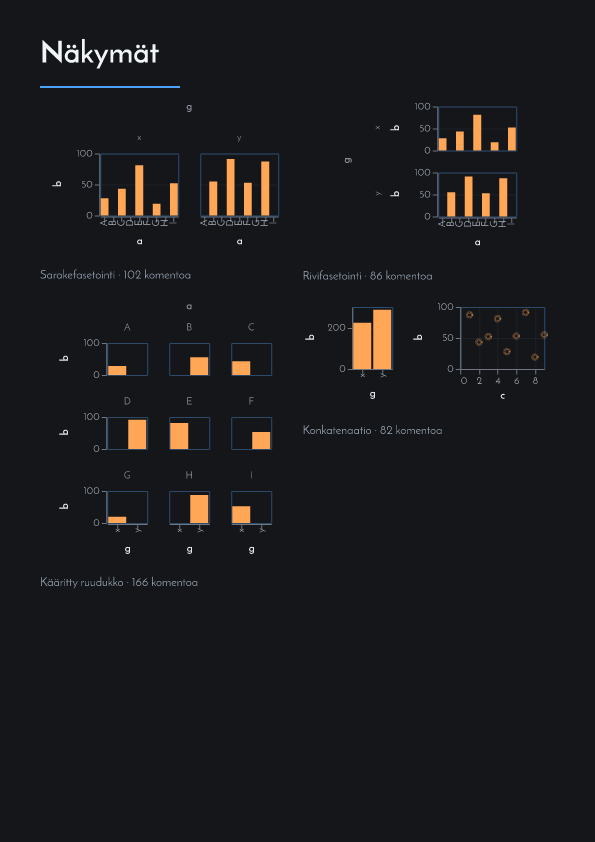
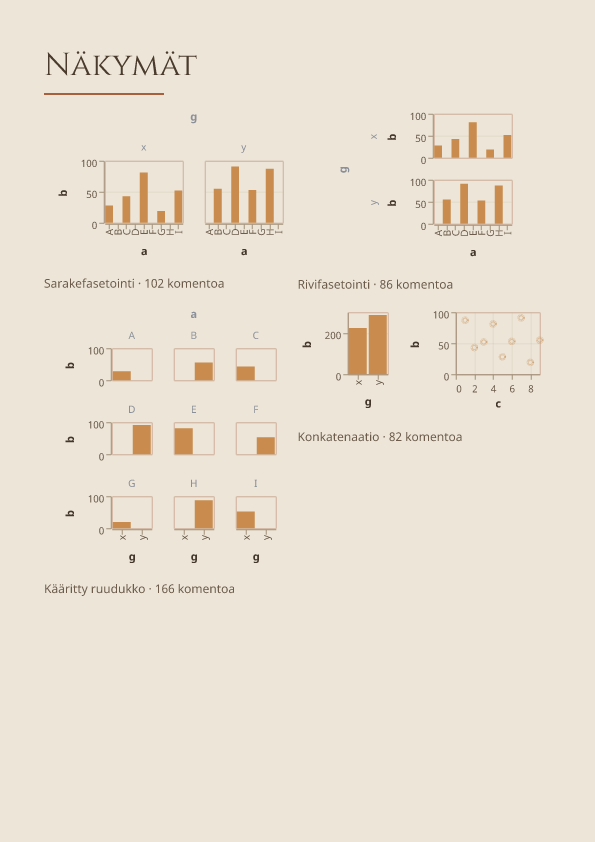
The four ways a chart can be more than one chart, all of them laid out by their own bounds rather than by a size anyone declared: a trellis by column, by row, and wrapped onto a grid whose shape is computed from the data, plus two plots concatenated with only the dimension across the join in common. The grid axes stay inside each panel; the labelled axes are drawn once, in the footer and the row header.
views.tsx — no visual attributes; every rule is in showcase.css
Flex open the page ›
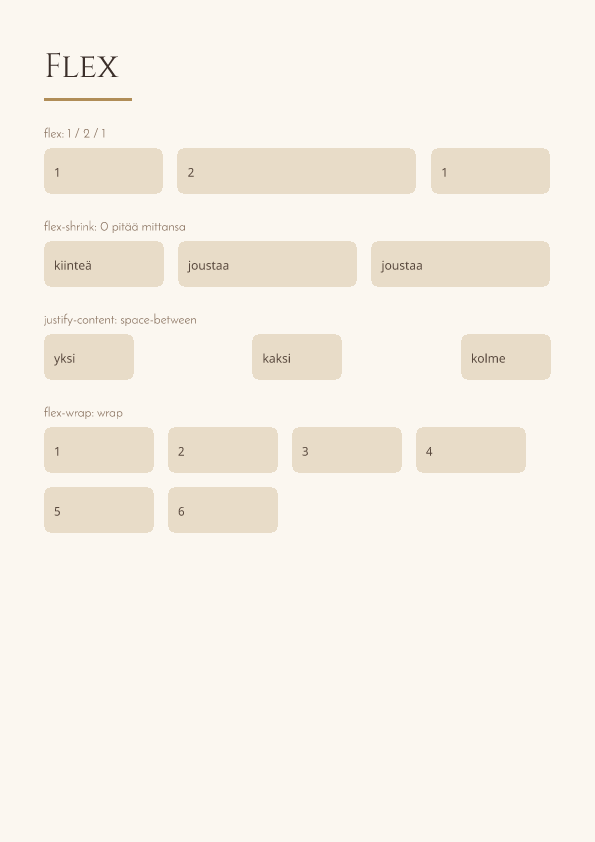
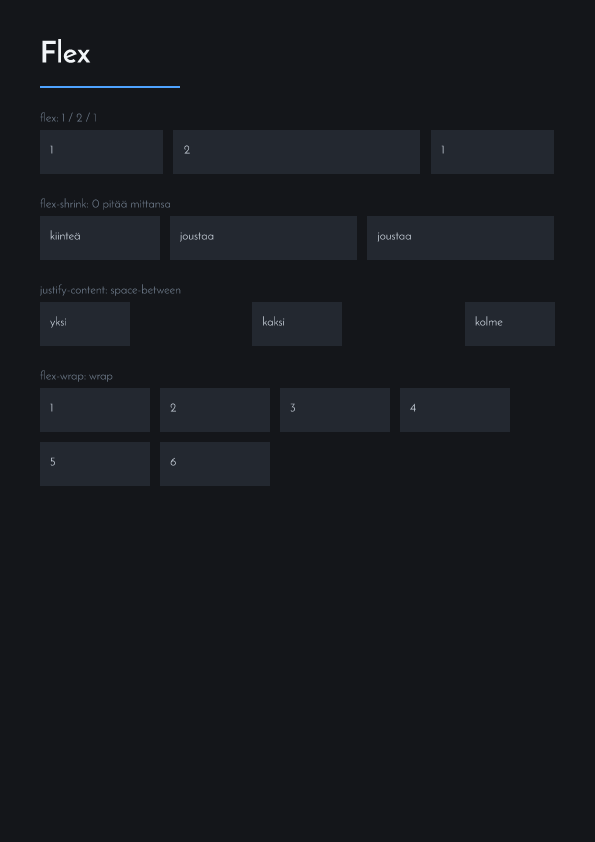
Grow, shrink and basis; wrapping; and what a row does with what is left over. Every arrangement is a class.
flex.tsx — no visual attributes; every rule is in showcase.css
Emoji open the page ›
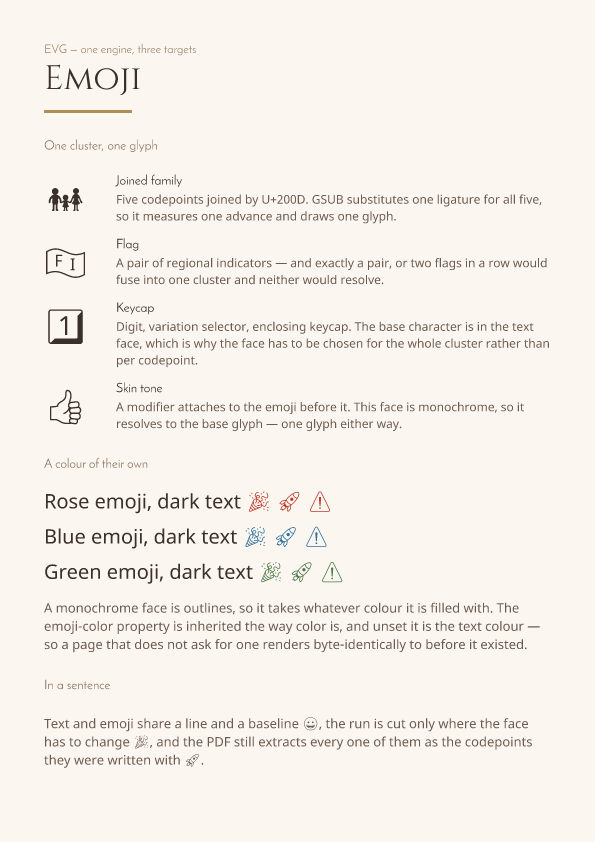
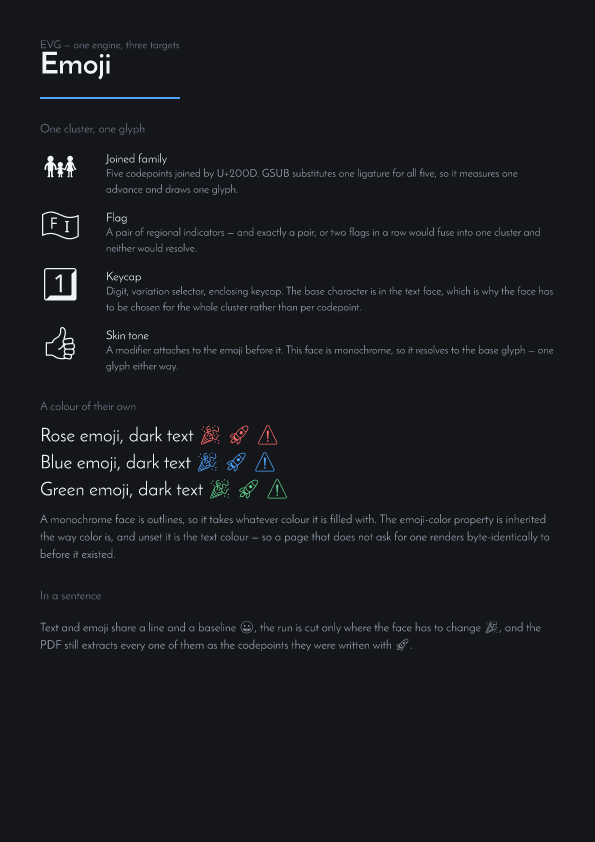
Each specimen is several codepoints and one glyph, and only becomes that glyph if the whole cluster reaches the shaper together. The tinted rows use emoji-color, which exists because there are no inline spans to hang a second colour on.
emoji.tsx — no visual attributes; every rule is in showcase.css
Box model open the page ›
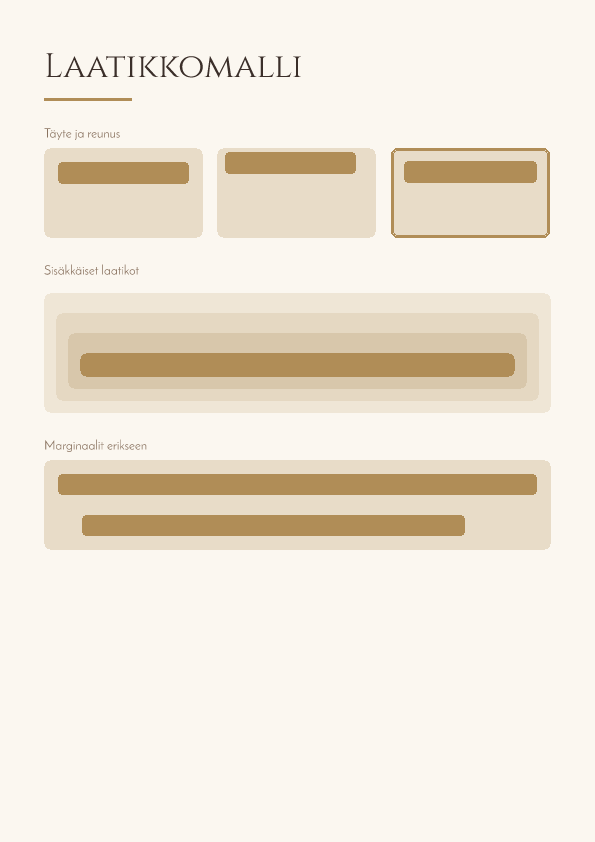
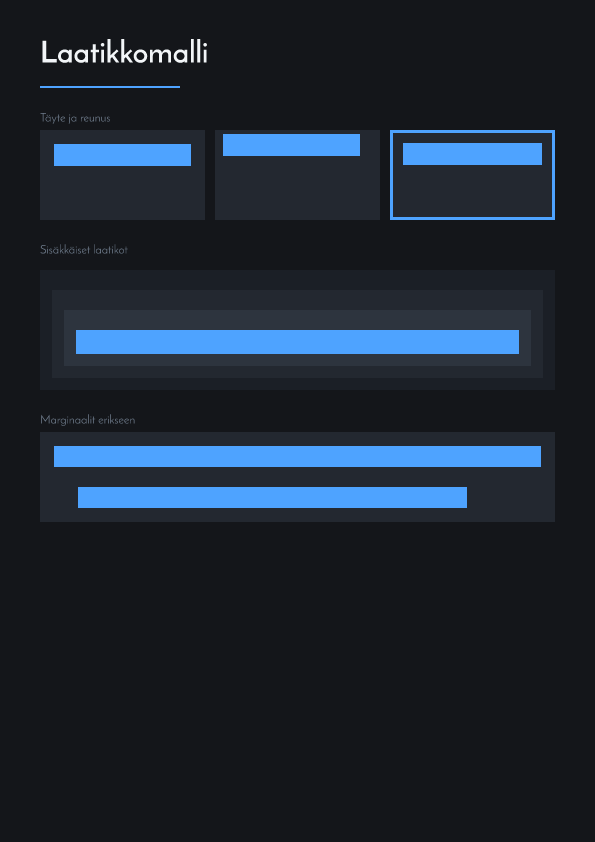
Padding, per-side padding, borders, nesting and margins — the same geometry the browser-parity gate checks against Chromium.
boxmodel.tsx — no visual attributes; every rule is in showcase.css
Engine warnings from this build
None. Every declaration on every page was honoured.